Prometheus 安装及配置
安装
基于 Docker 容器安装,总共安装了三个镜像(bitnami/prometheus、grafana/grafana、node-exporter)
创建挂载目录/文件
prometheus数据挂载目录注意⚠️:必须要赋予权限
mkdir prometheus_data
chown -R 1001:1001  prometheus_data
创建
prometheus.yml配置文件global: scrape_interval: 15s scrape_configs: - job_name: 'prometheus' static_configs: - targets: ['localhost:9090'] # 下面这个 job 可以先省略,后面安装了 node-exporte,再配置 - job_name: 'node_exporter' static_configs: - targets: ['192.168.2.80:9100']grafana数据挂载目录注意⚠️:必须要赋予权限
mkdir grafana_data
chown 472:472 grafana_data
创建
grafana.ini配置文件这个配置文件内容太多了,建议是先启动一个容器,然后从容器中拷贝出来
docker cp 容器ID:/etc/grafana/grafana.ini ./
创建启动文件
docker-compose.yml文件services: prometheus: image: bitnami/prometheus:latest container_name: prometheus volumes: - ./prometheus_data:/opt/bitnami/prometheus/data - ./prometheus.yml:/opt/bitnami/prometheus/conf/prometheus.yml ports: - "9090:9090" grafana: image: grafana/grafana:latest container_name: grafana environment: - GF_SERVER_ROOT_URL=http://grafana.server.name - GF_SECURITY_ADMIN_PASSWORD=admin - GF_SECURITY_ADMIN_USER=admin volumes: - ./grafana_data:/var/lib/grafana - ./grafana.ini:/etc/grafana/grafana.ini ports: - "3000:3000" depends_on: - prometheus
启动
node_exporter
我这个容器是用来监测我宿主机的指标情况的(cpu、内存、存储等等),默认端口:9100
docker run -d \
  --name=node_exporter \
  --net="host" \
  prom/node-exporter:latest
prometheus、grafana
docker-compose up -d ./docker-compose.yml
访问
node_exporter
http://192.168.2.80:9100/metrics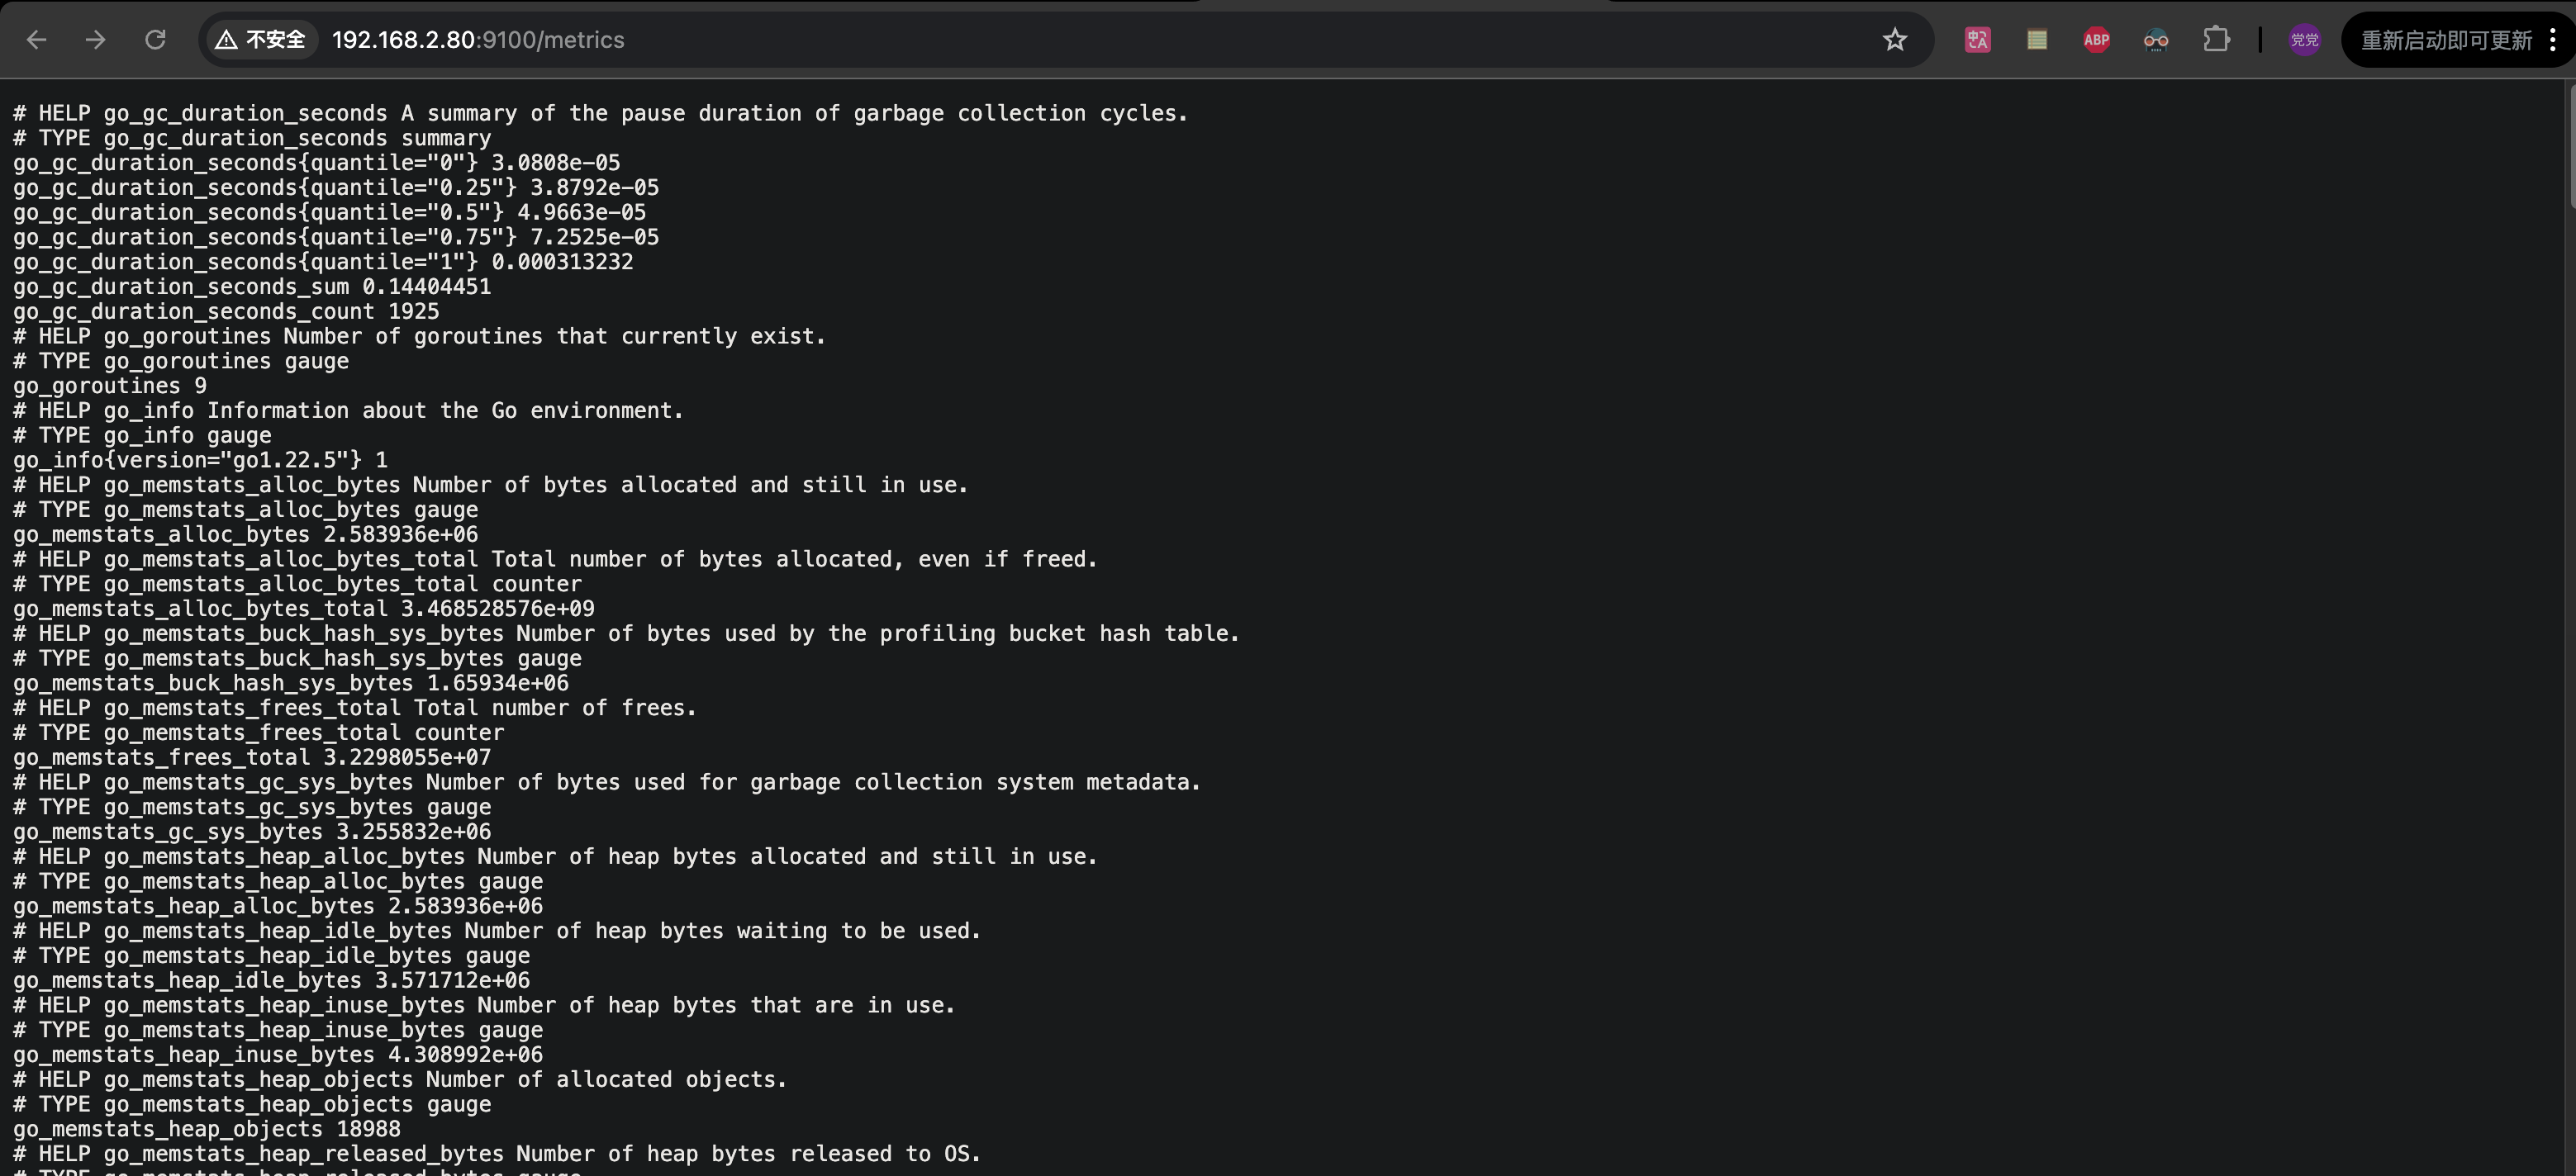
prometheus
http://192.168.2.80:9090/graph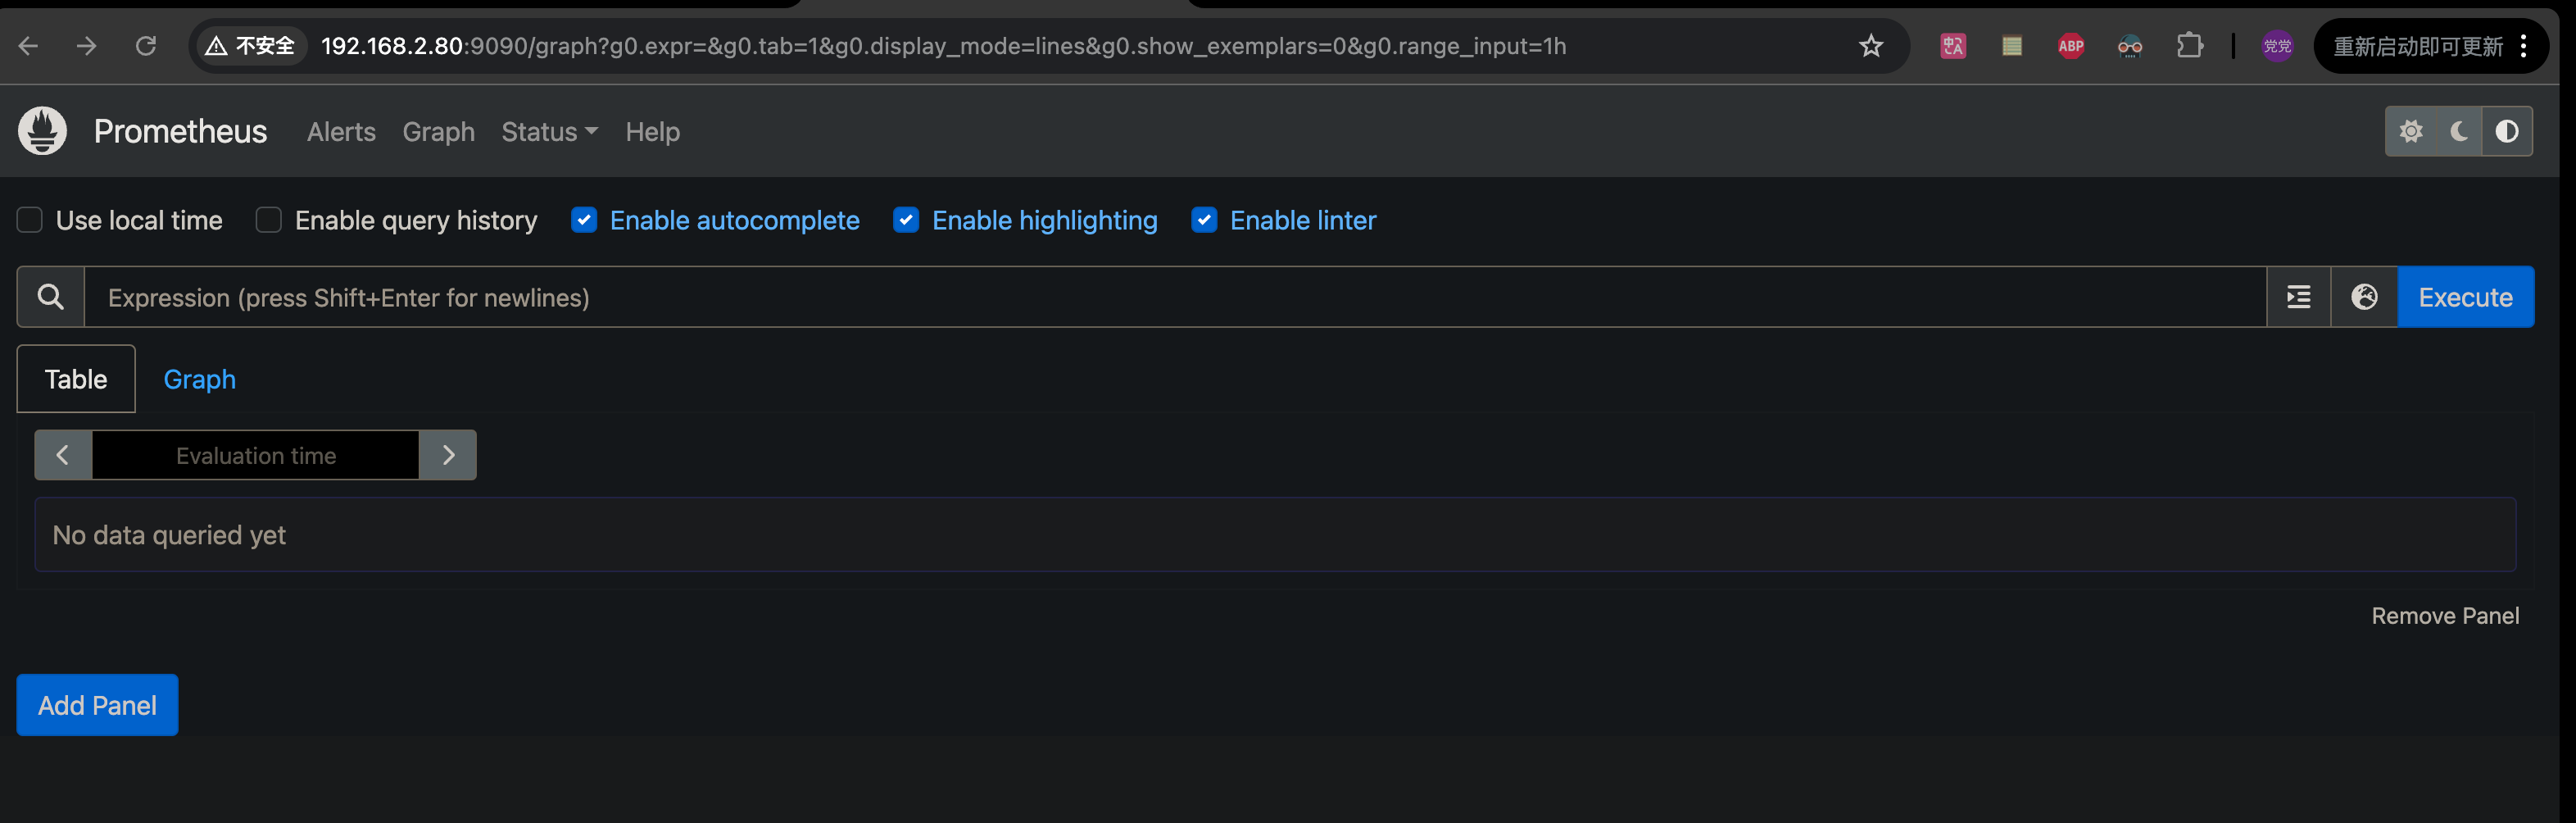
grafana
http://192.168.2.80:3000/login
配置
中文配置
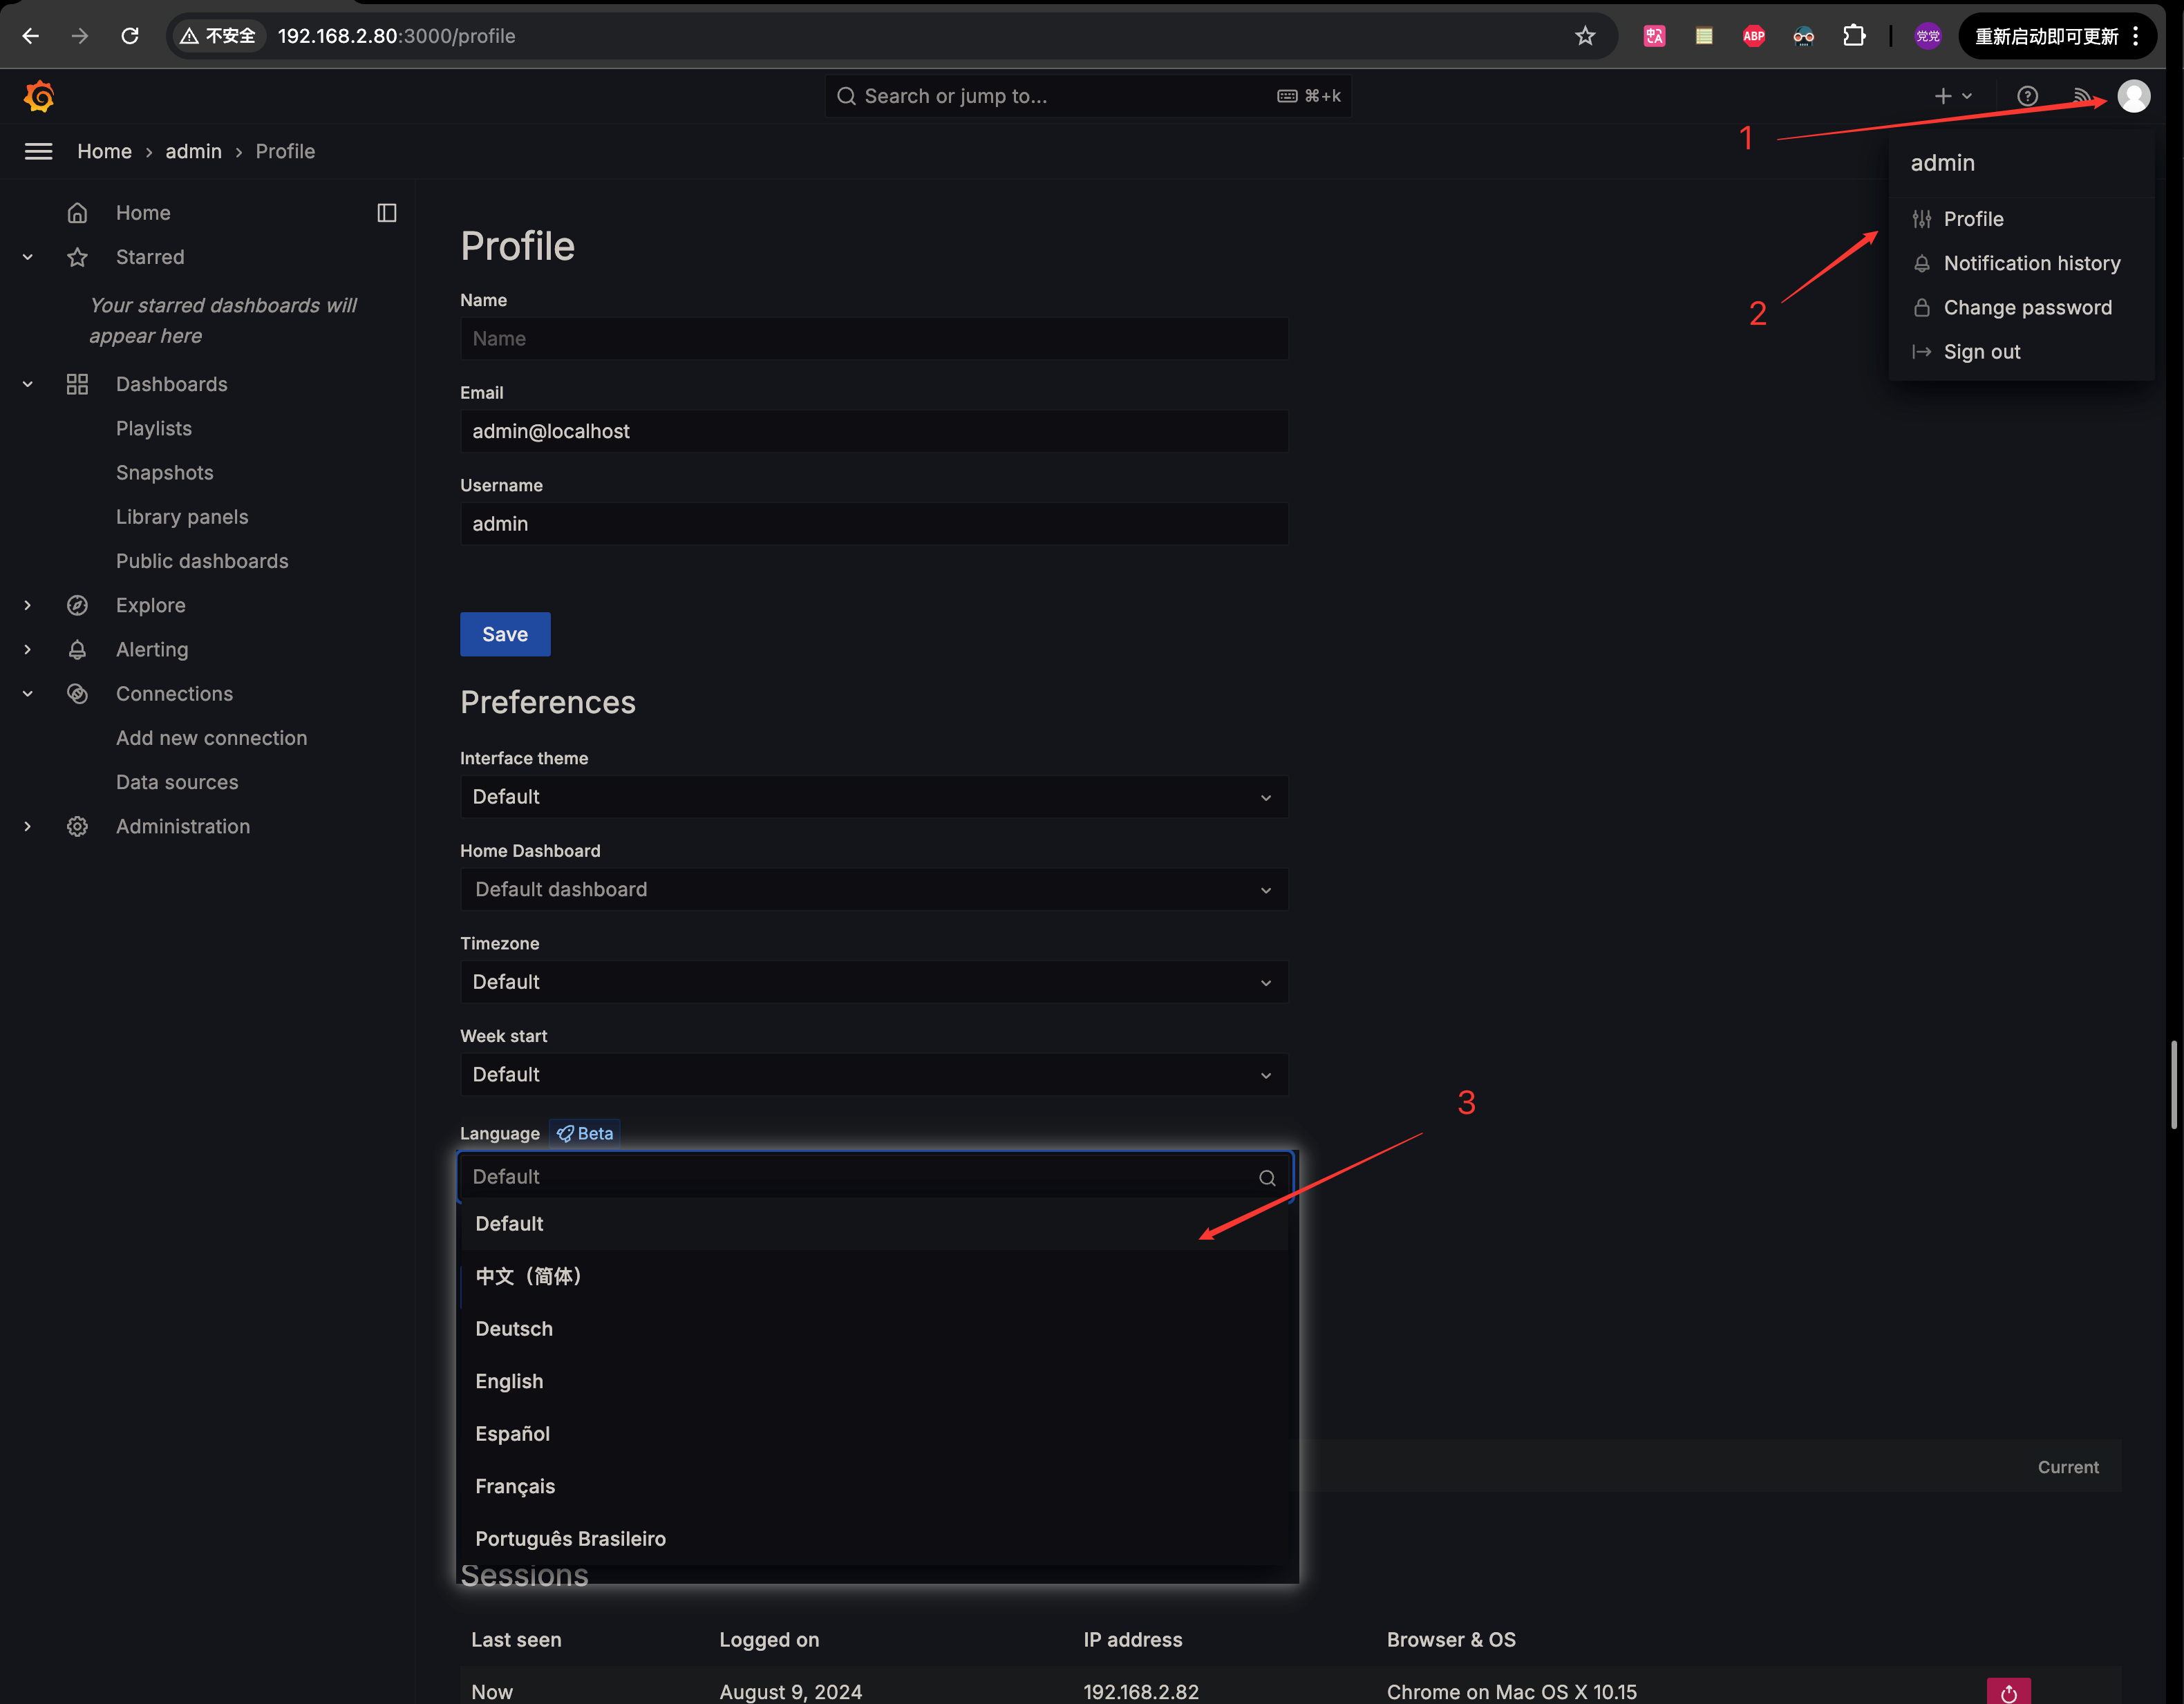
添加数据源
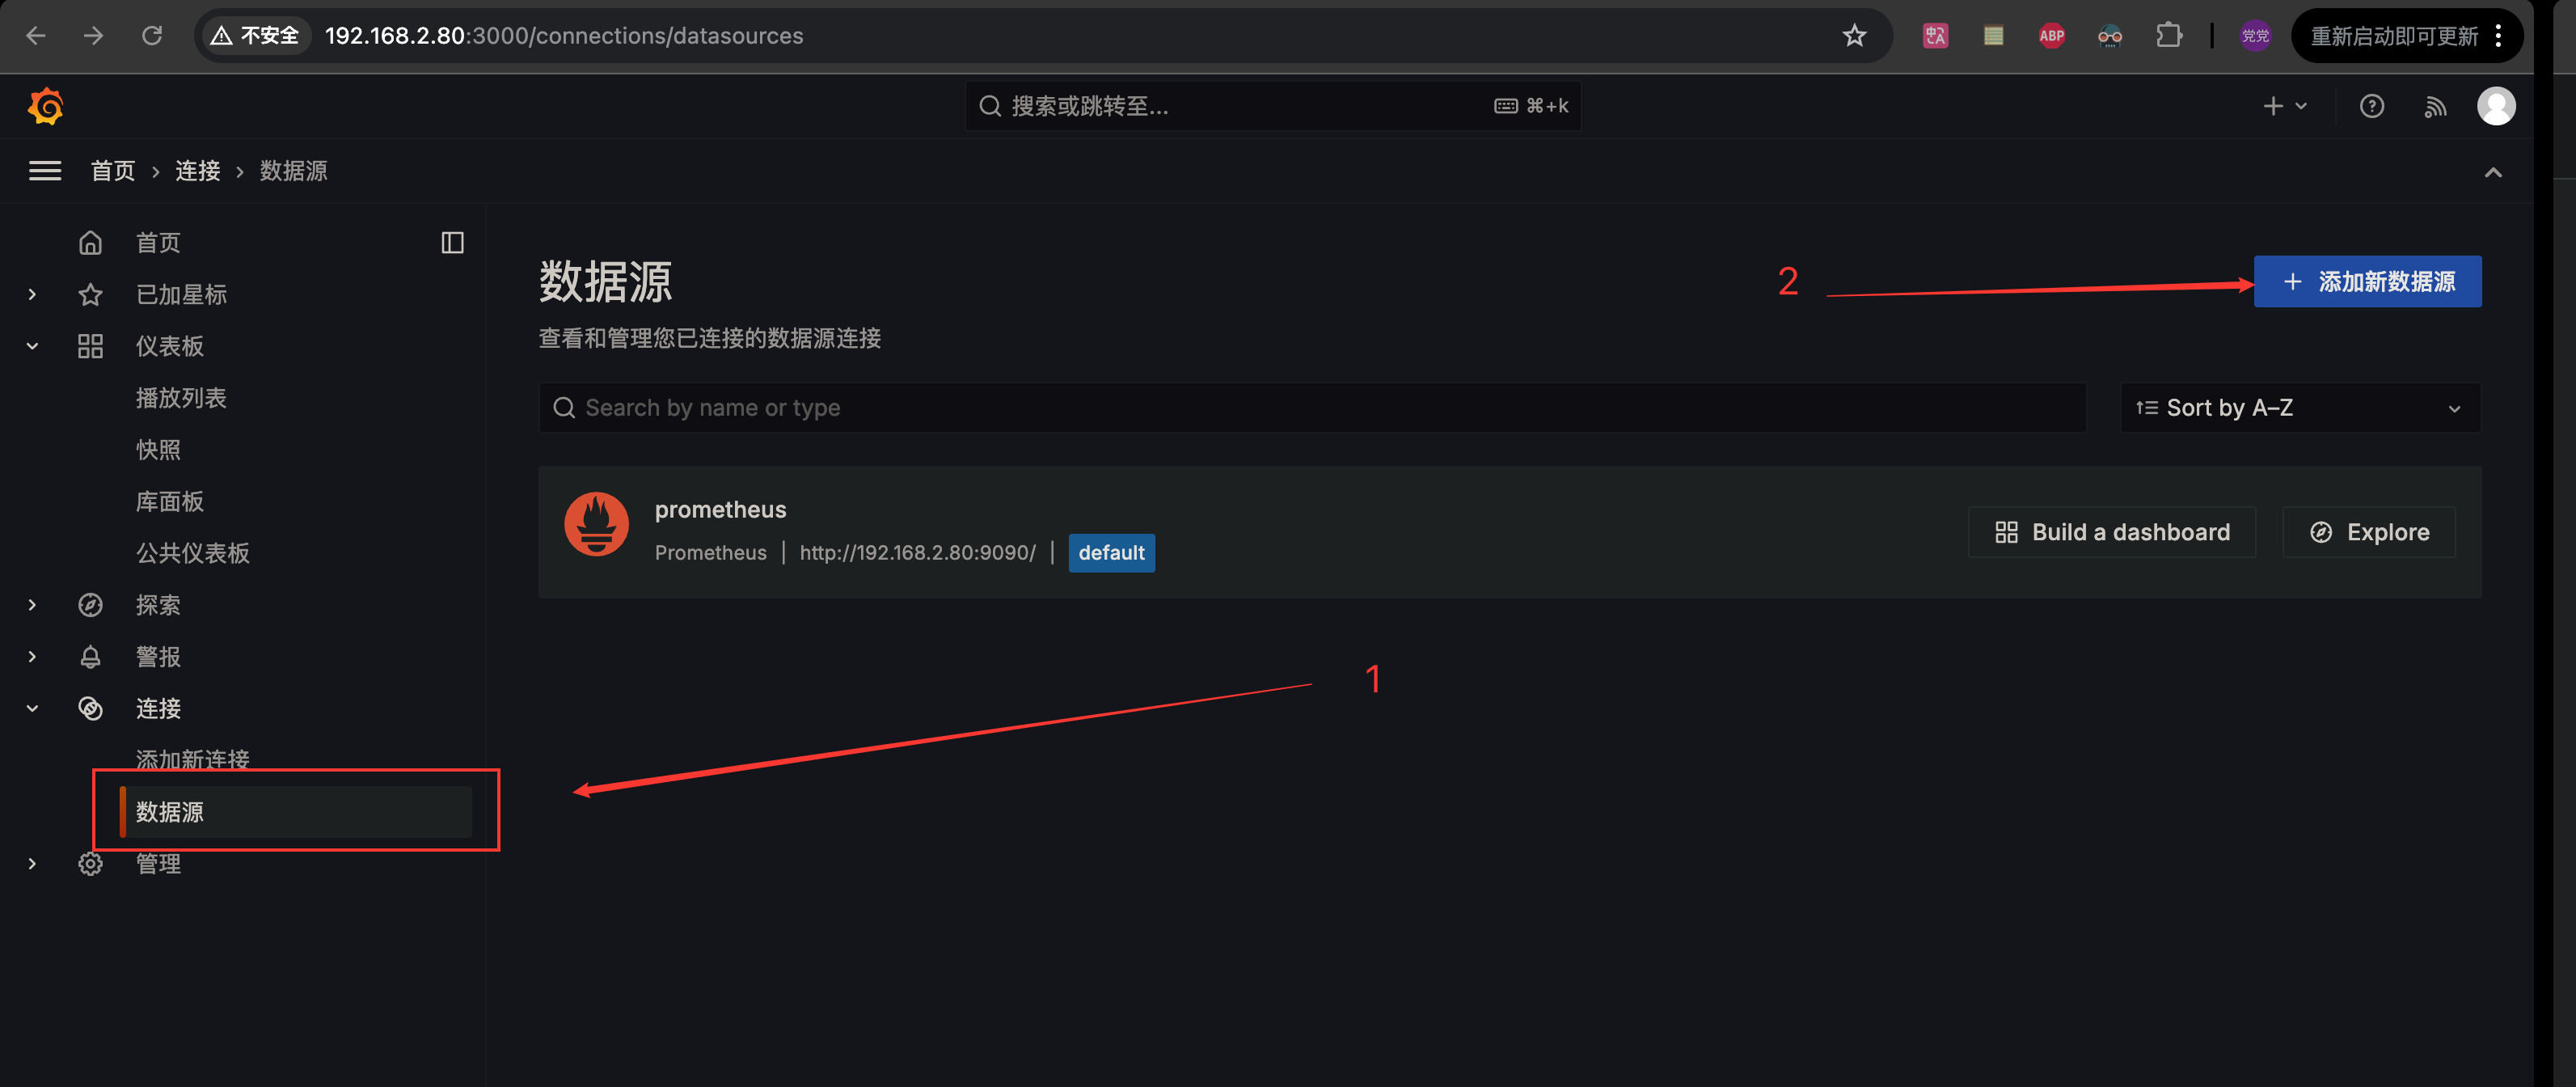
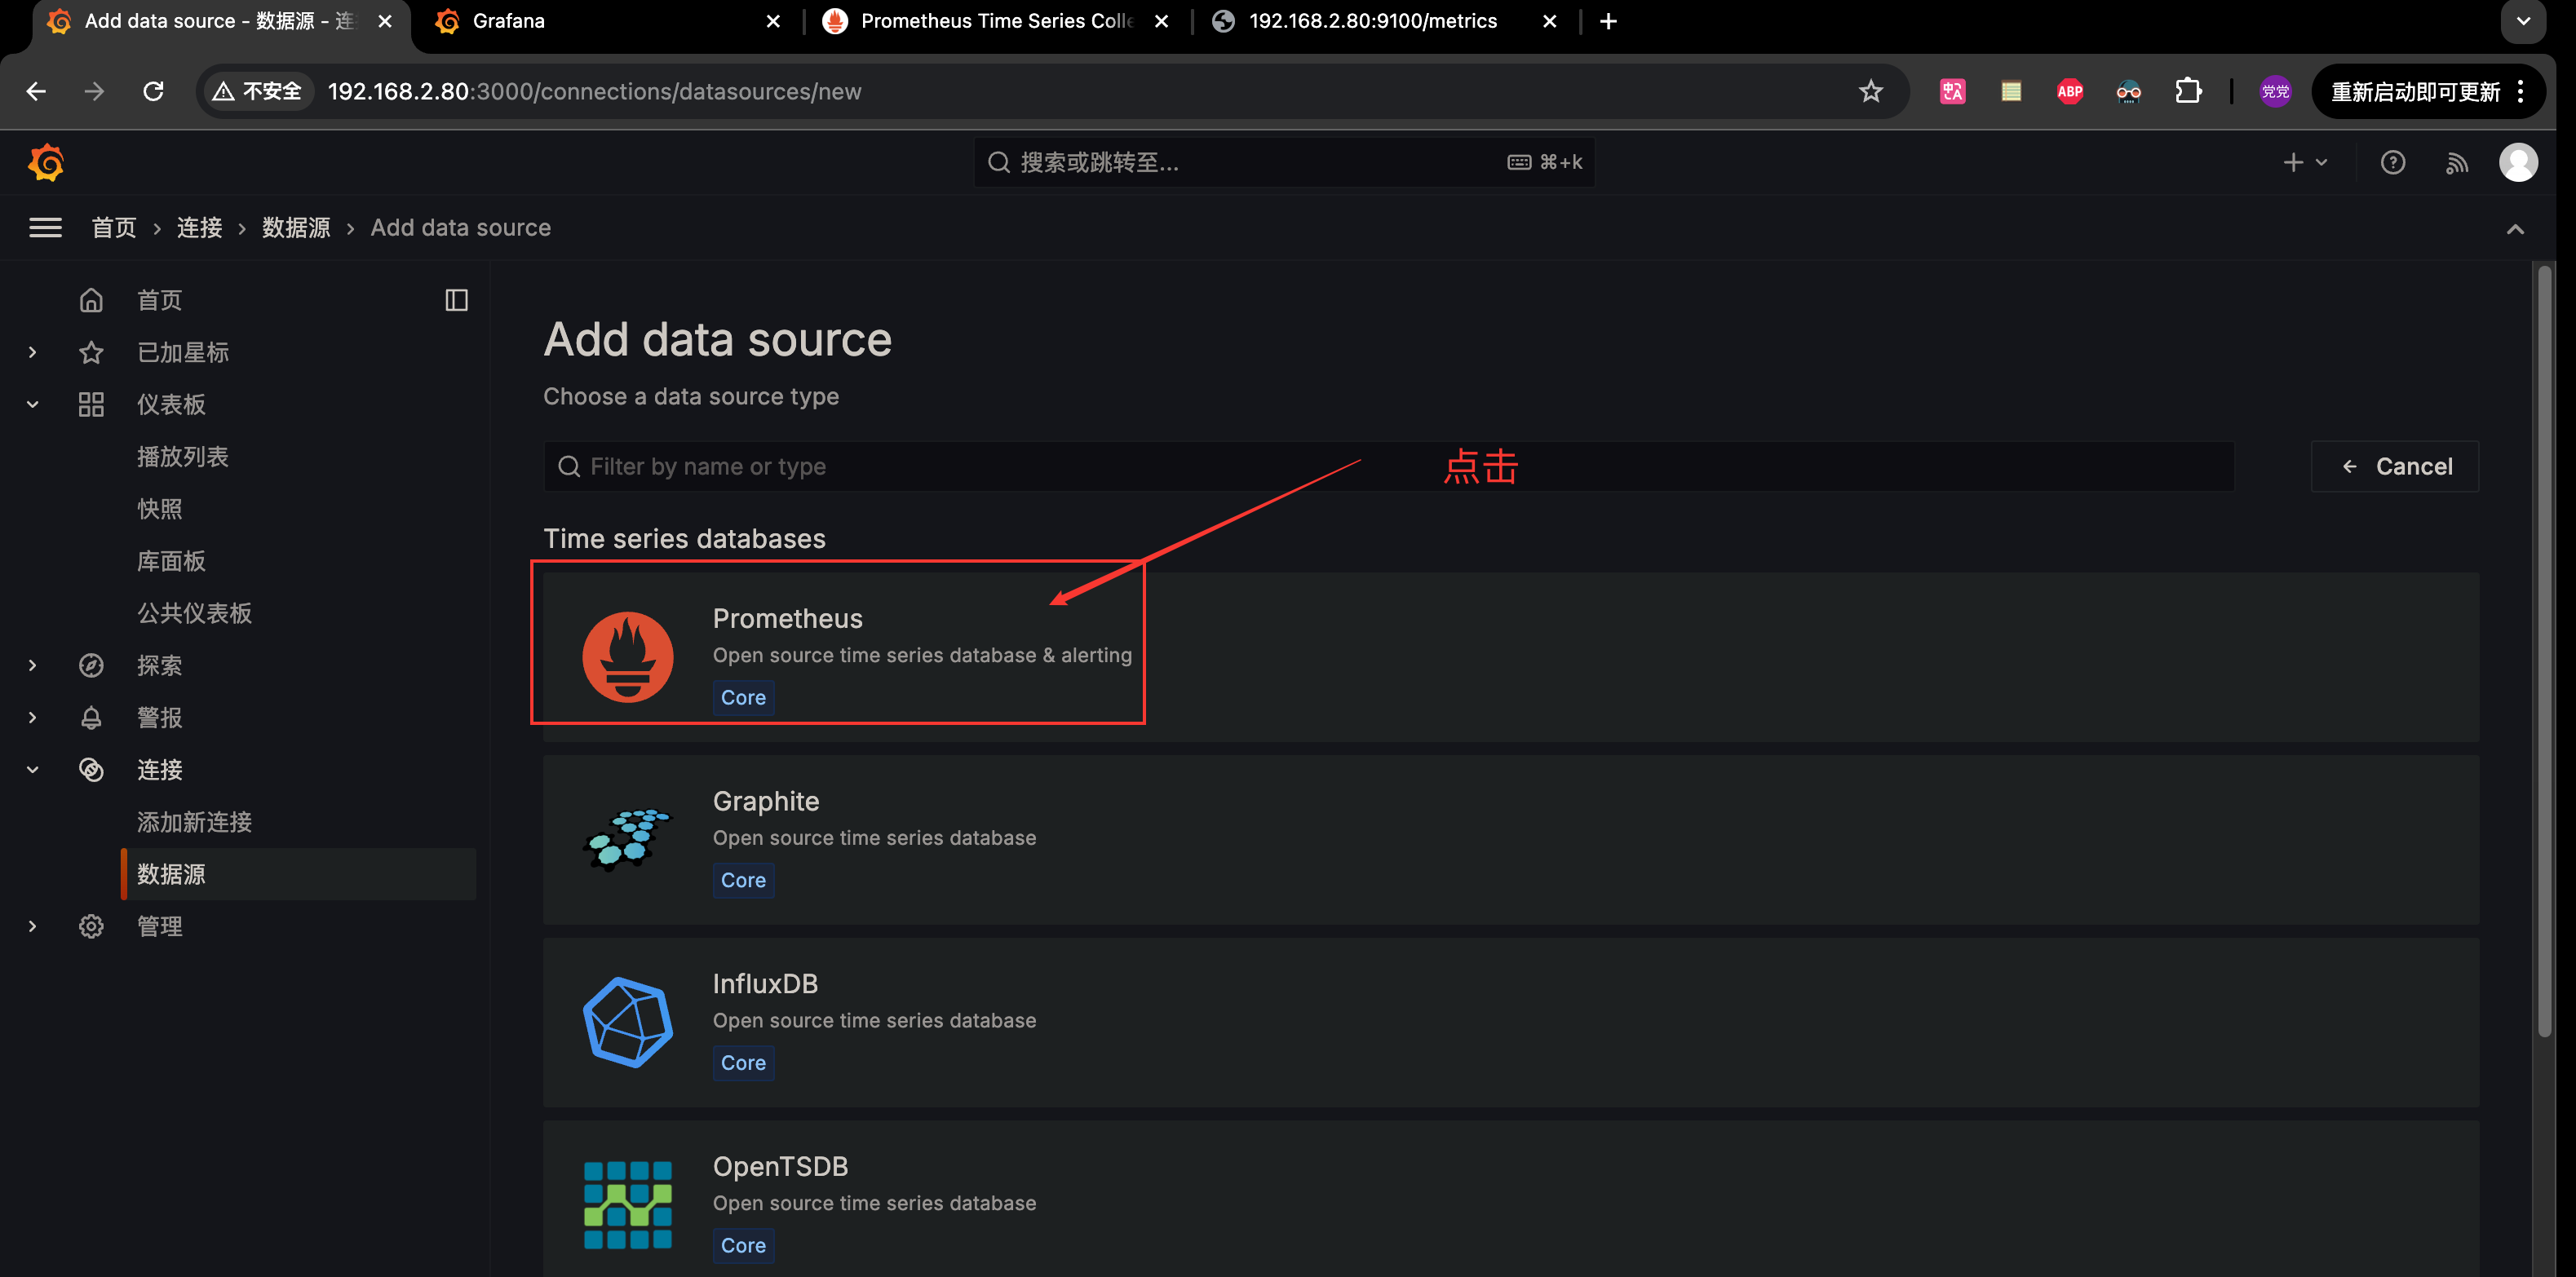
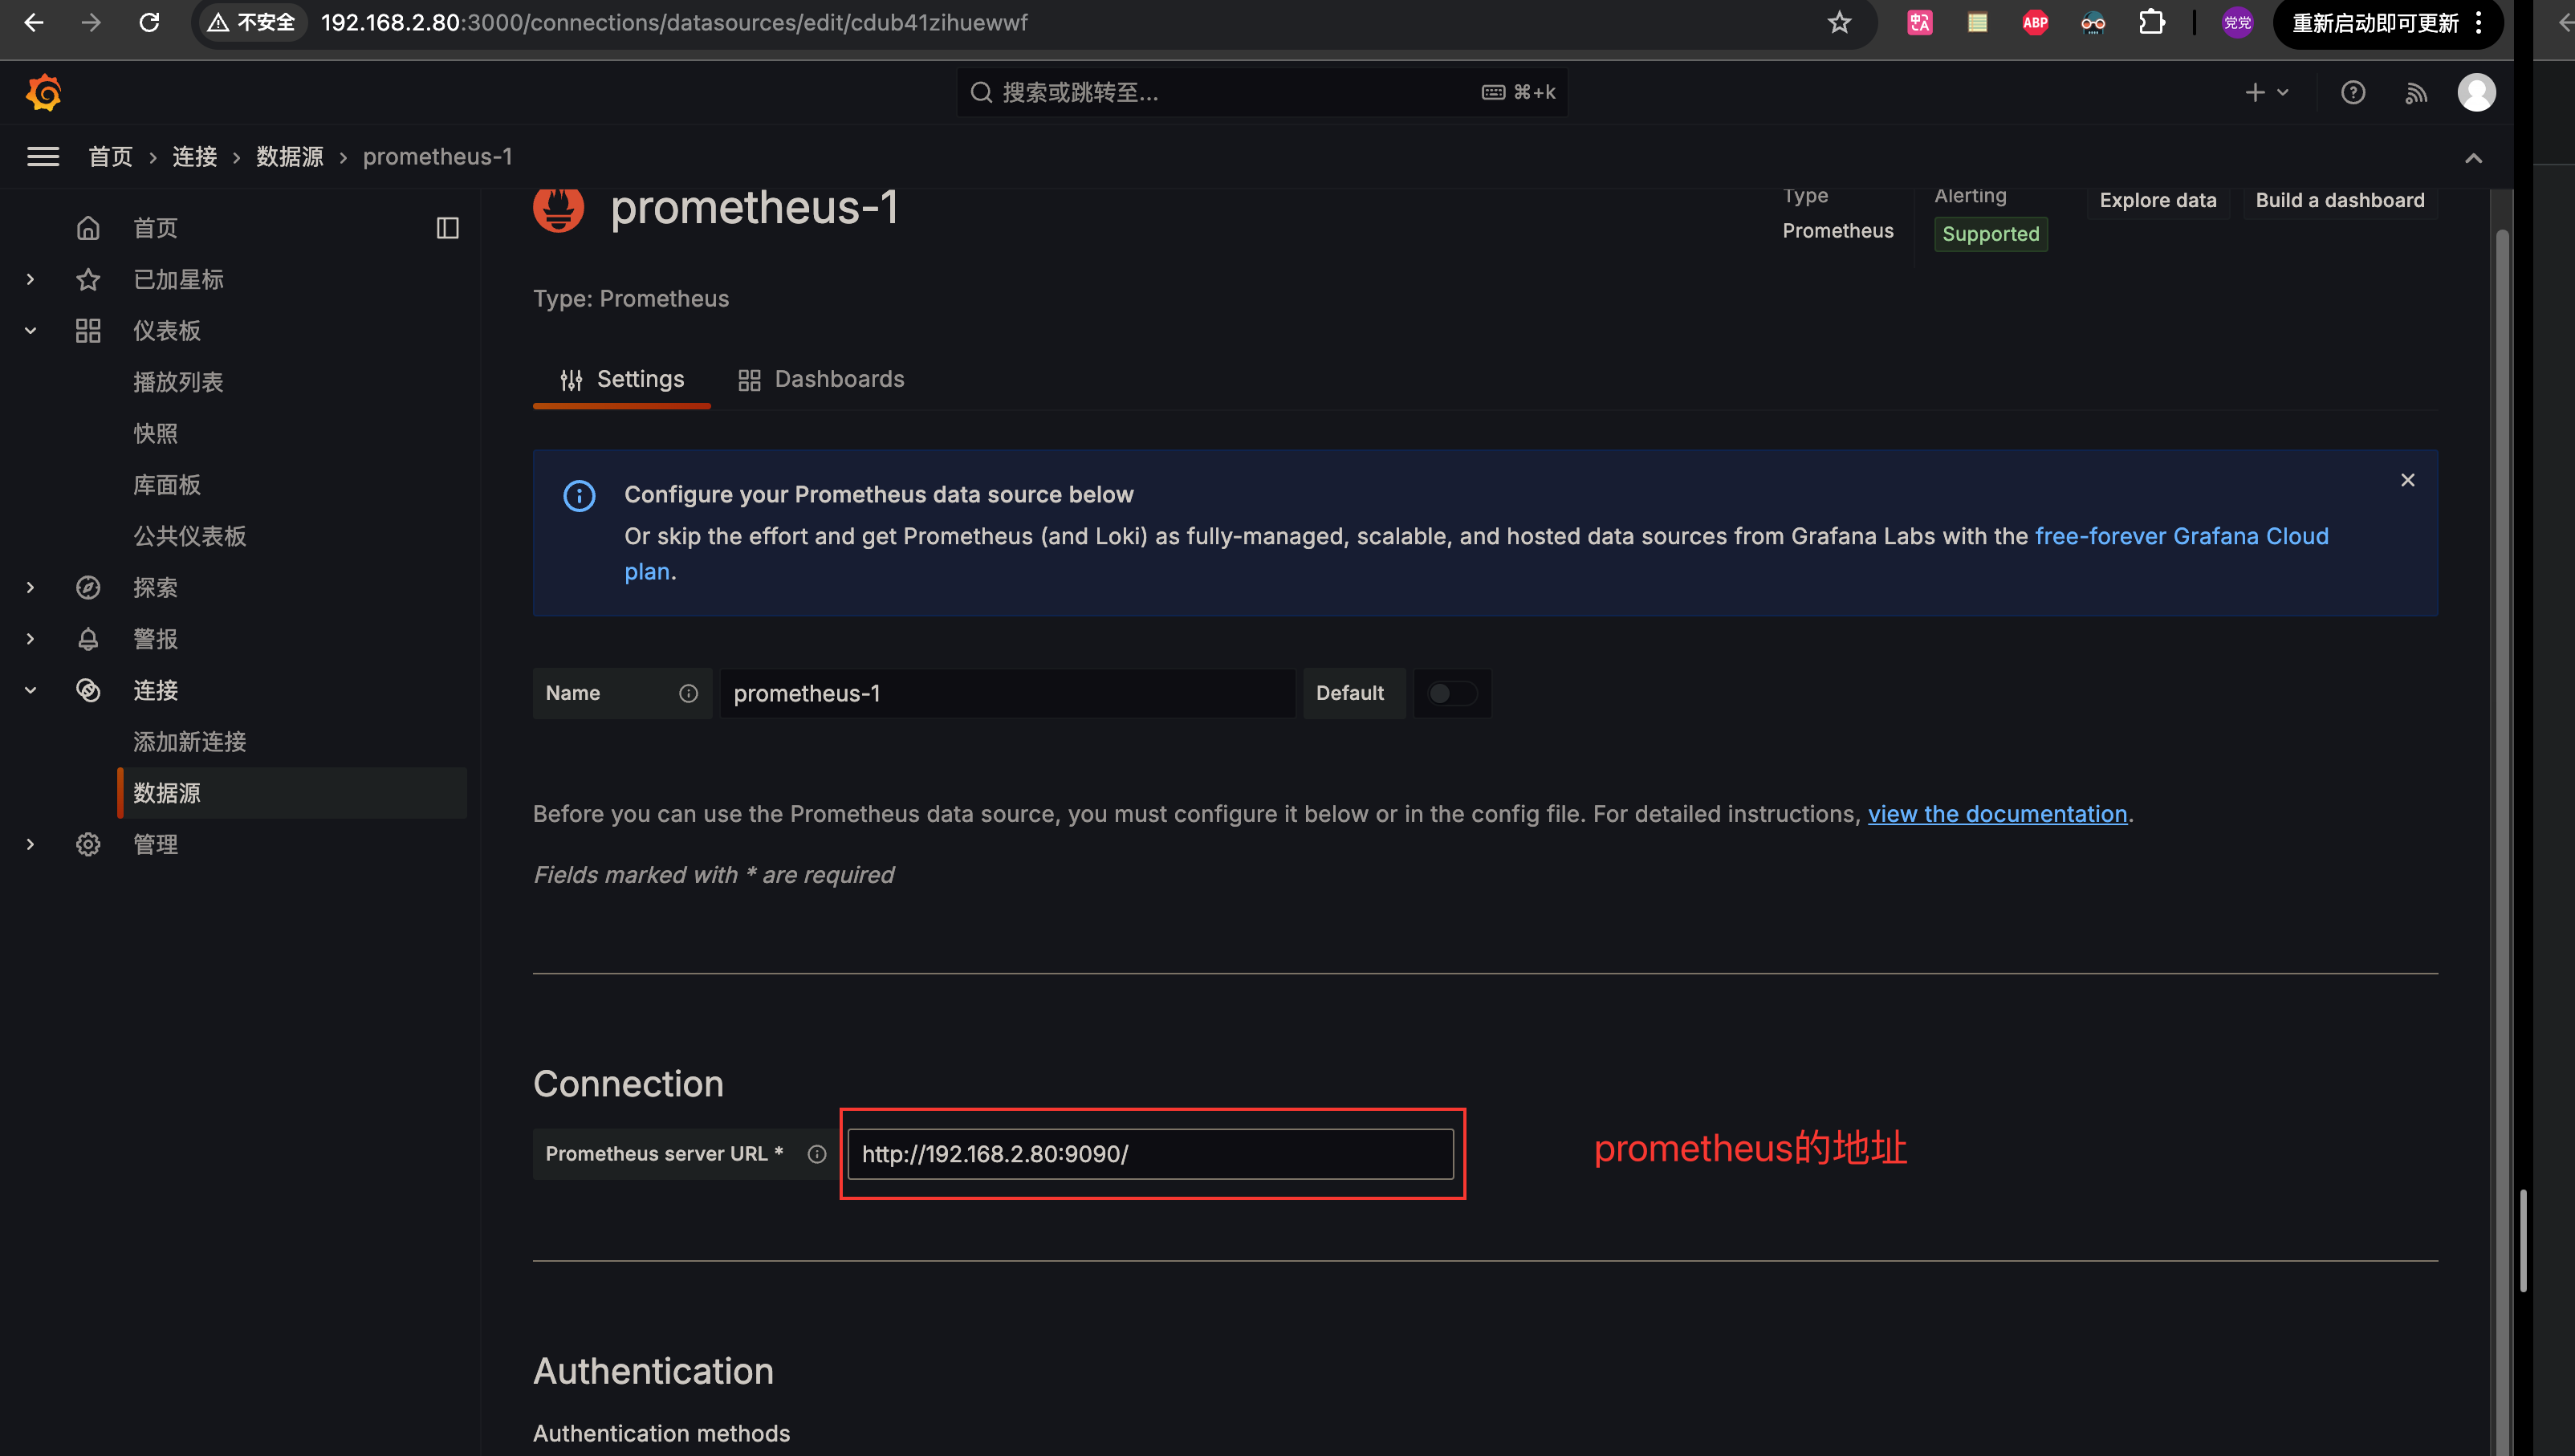
只添加这一个地址就可以保存了。
仪表板
因为
Grafana有各种各样的仪表板、例如 ES、mysql等等;当然
Grafana他本身是只是提供了制作仪表板功能;也就是可以通过导入别人已经做好、也可以自己动手搞(界面只有英文哦);我下面是通过
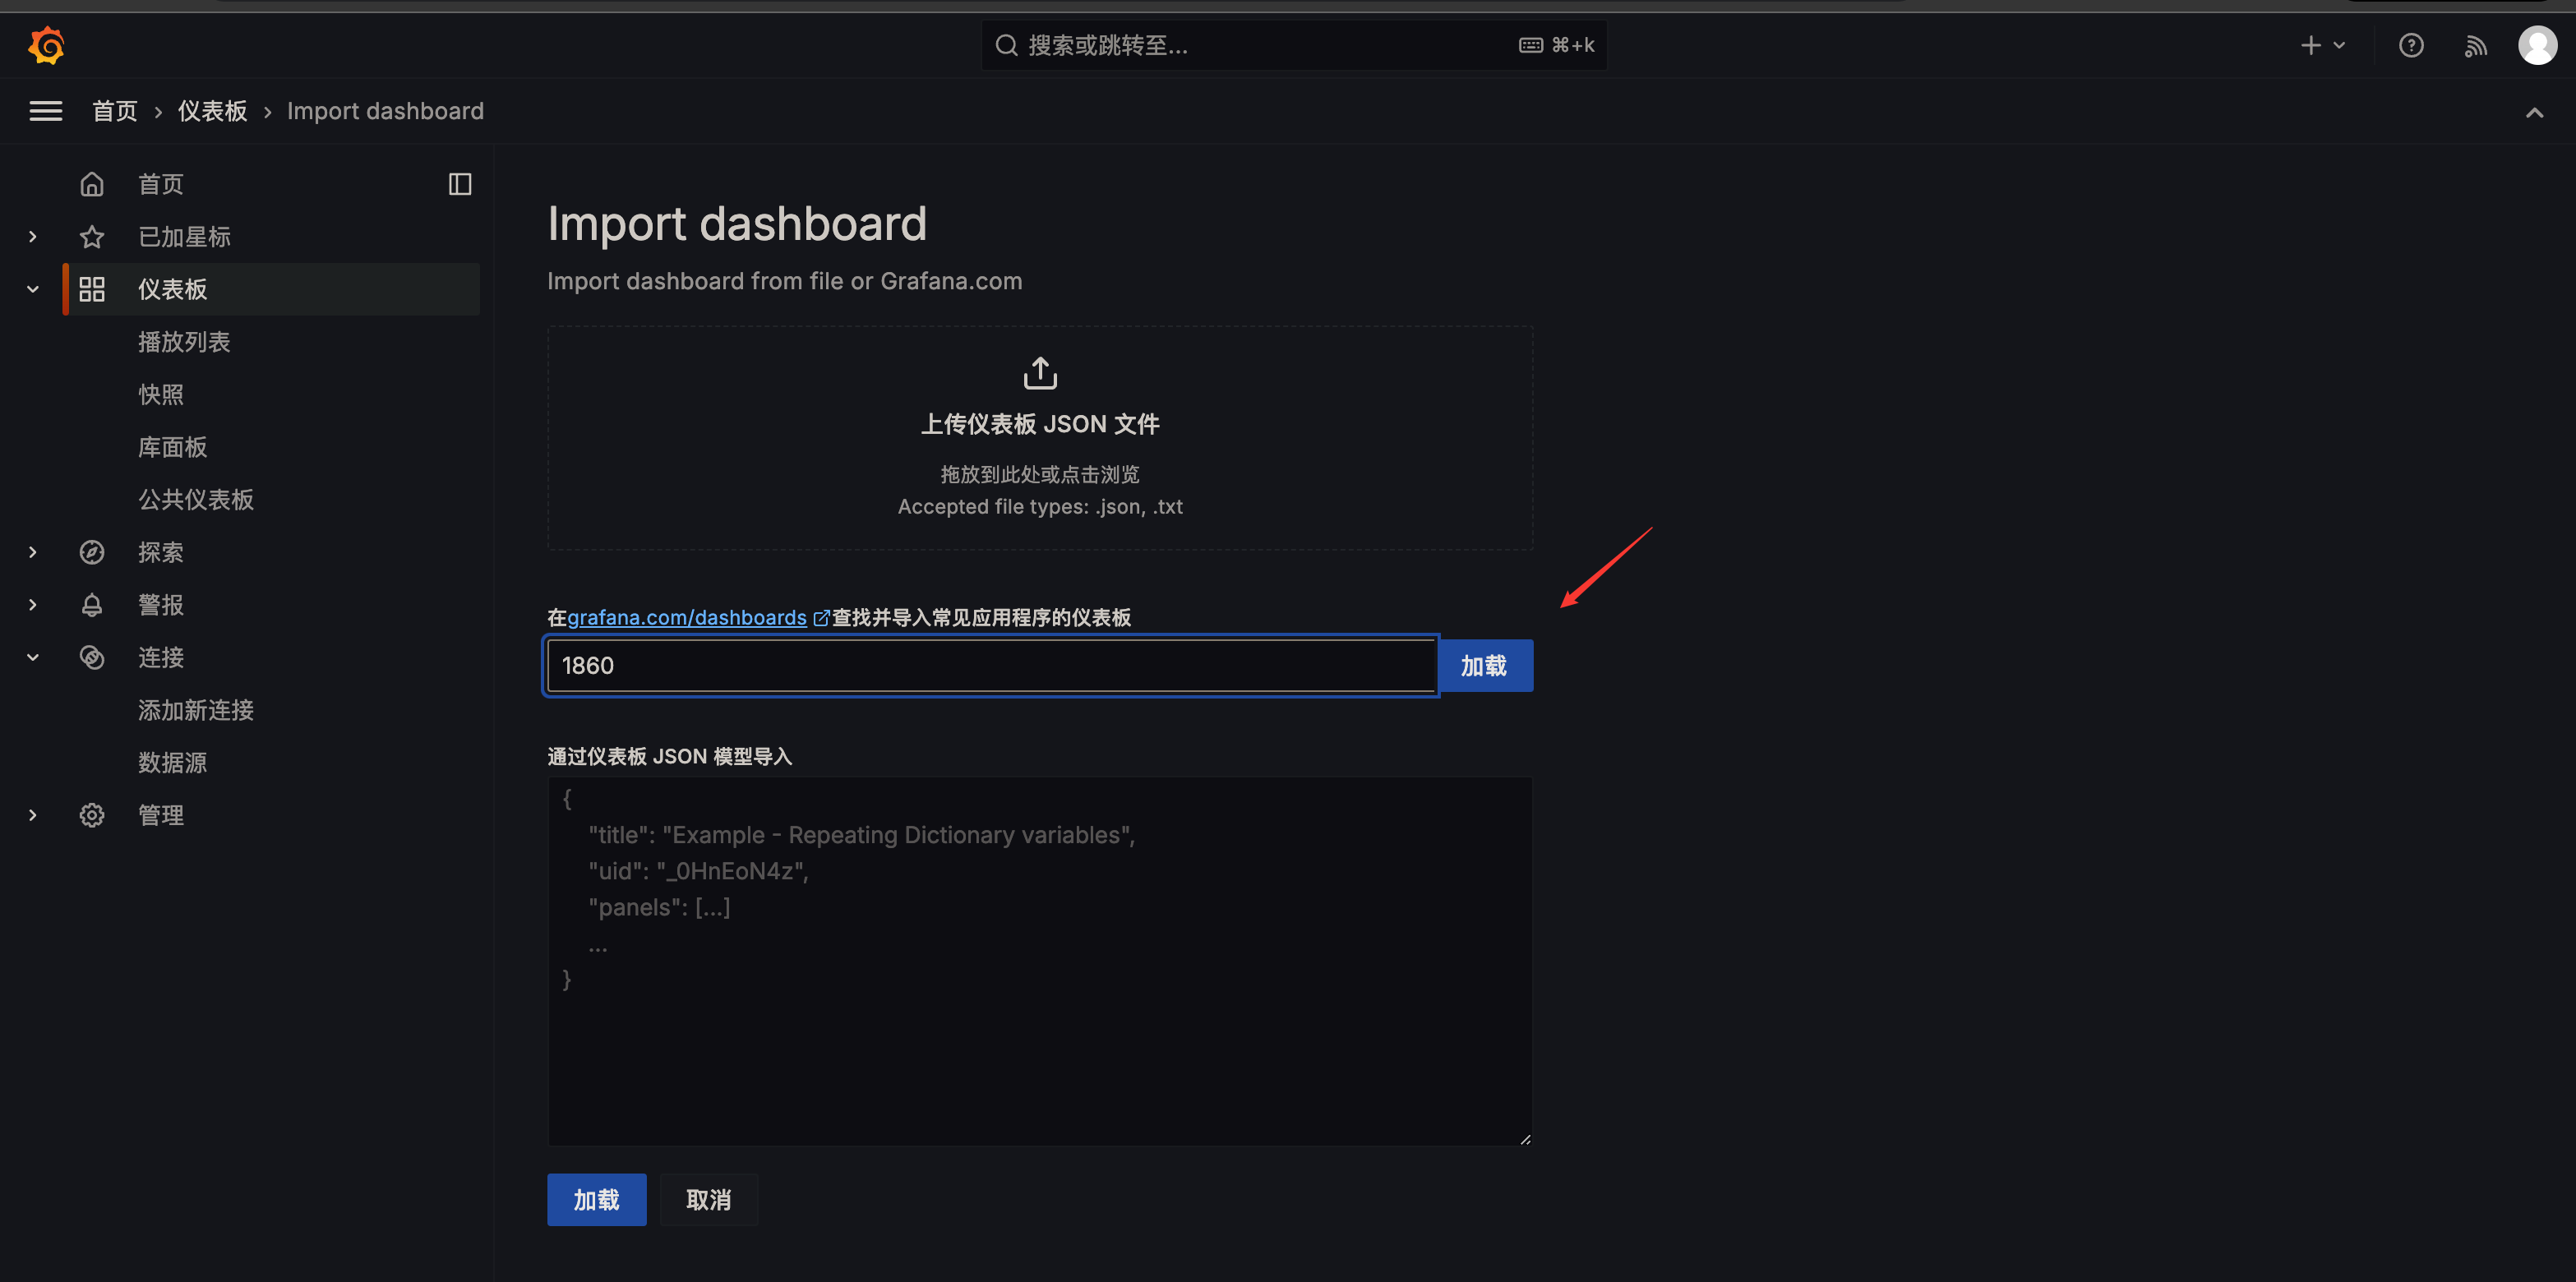
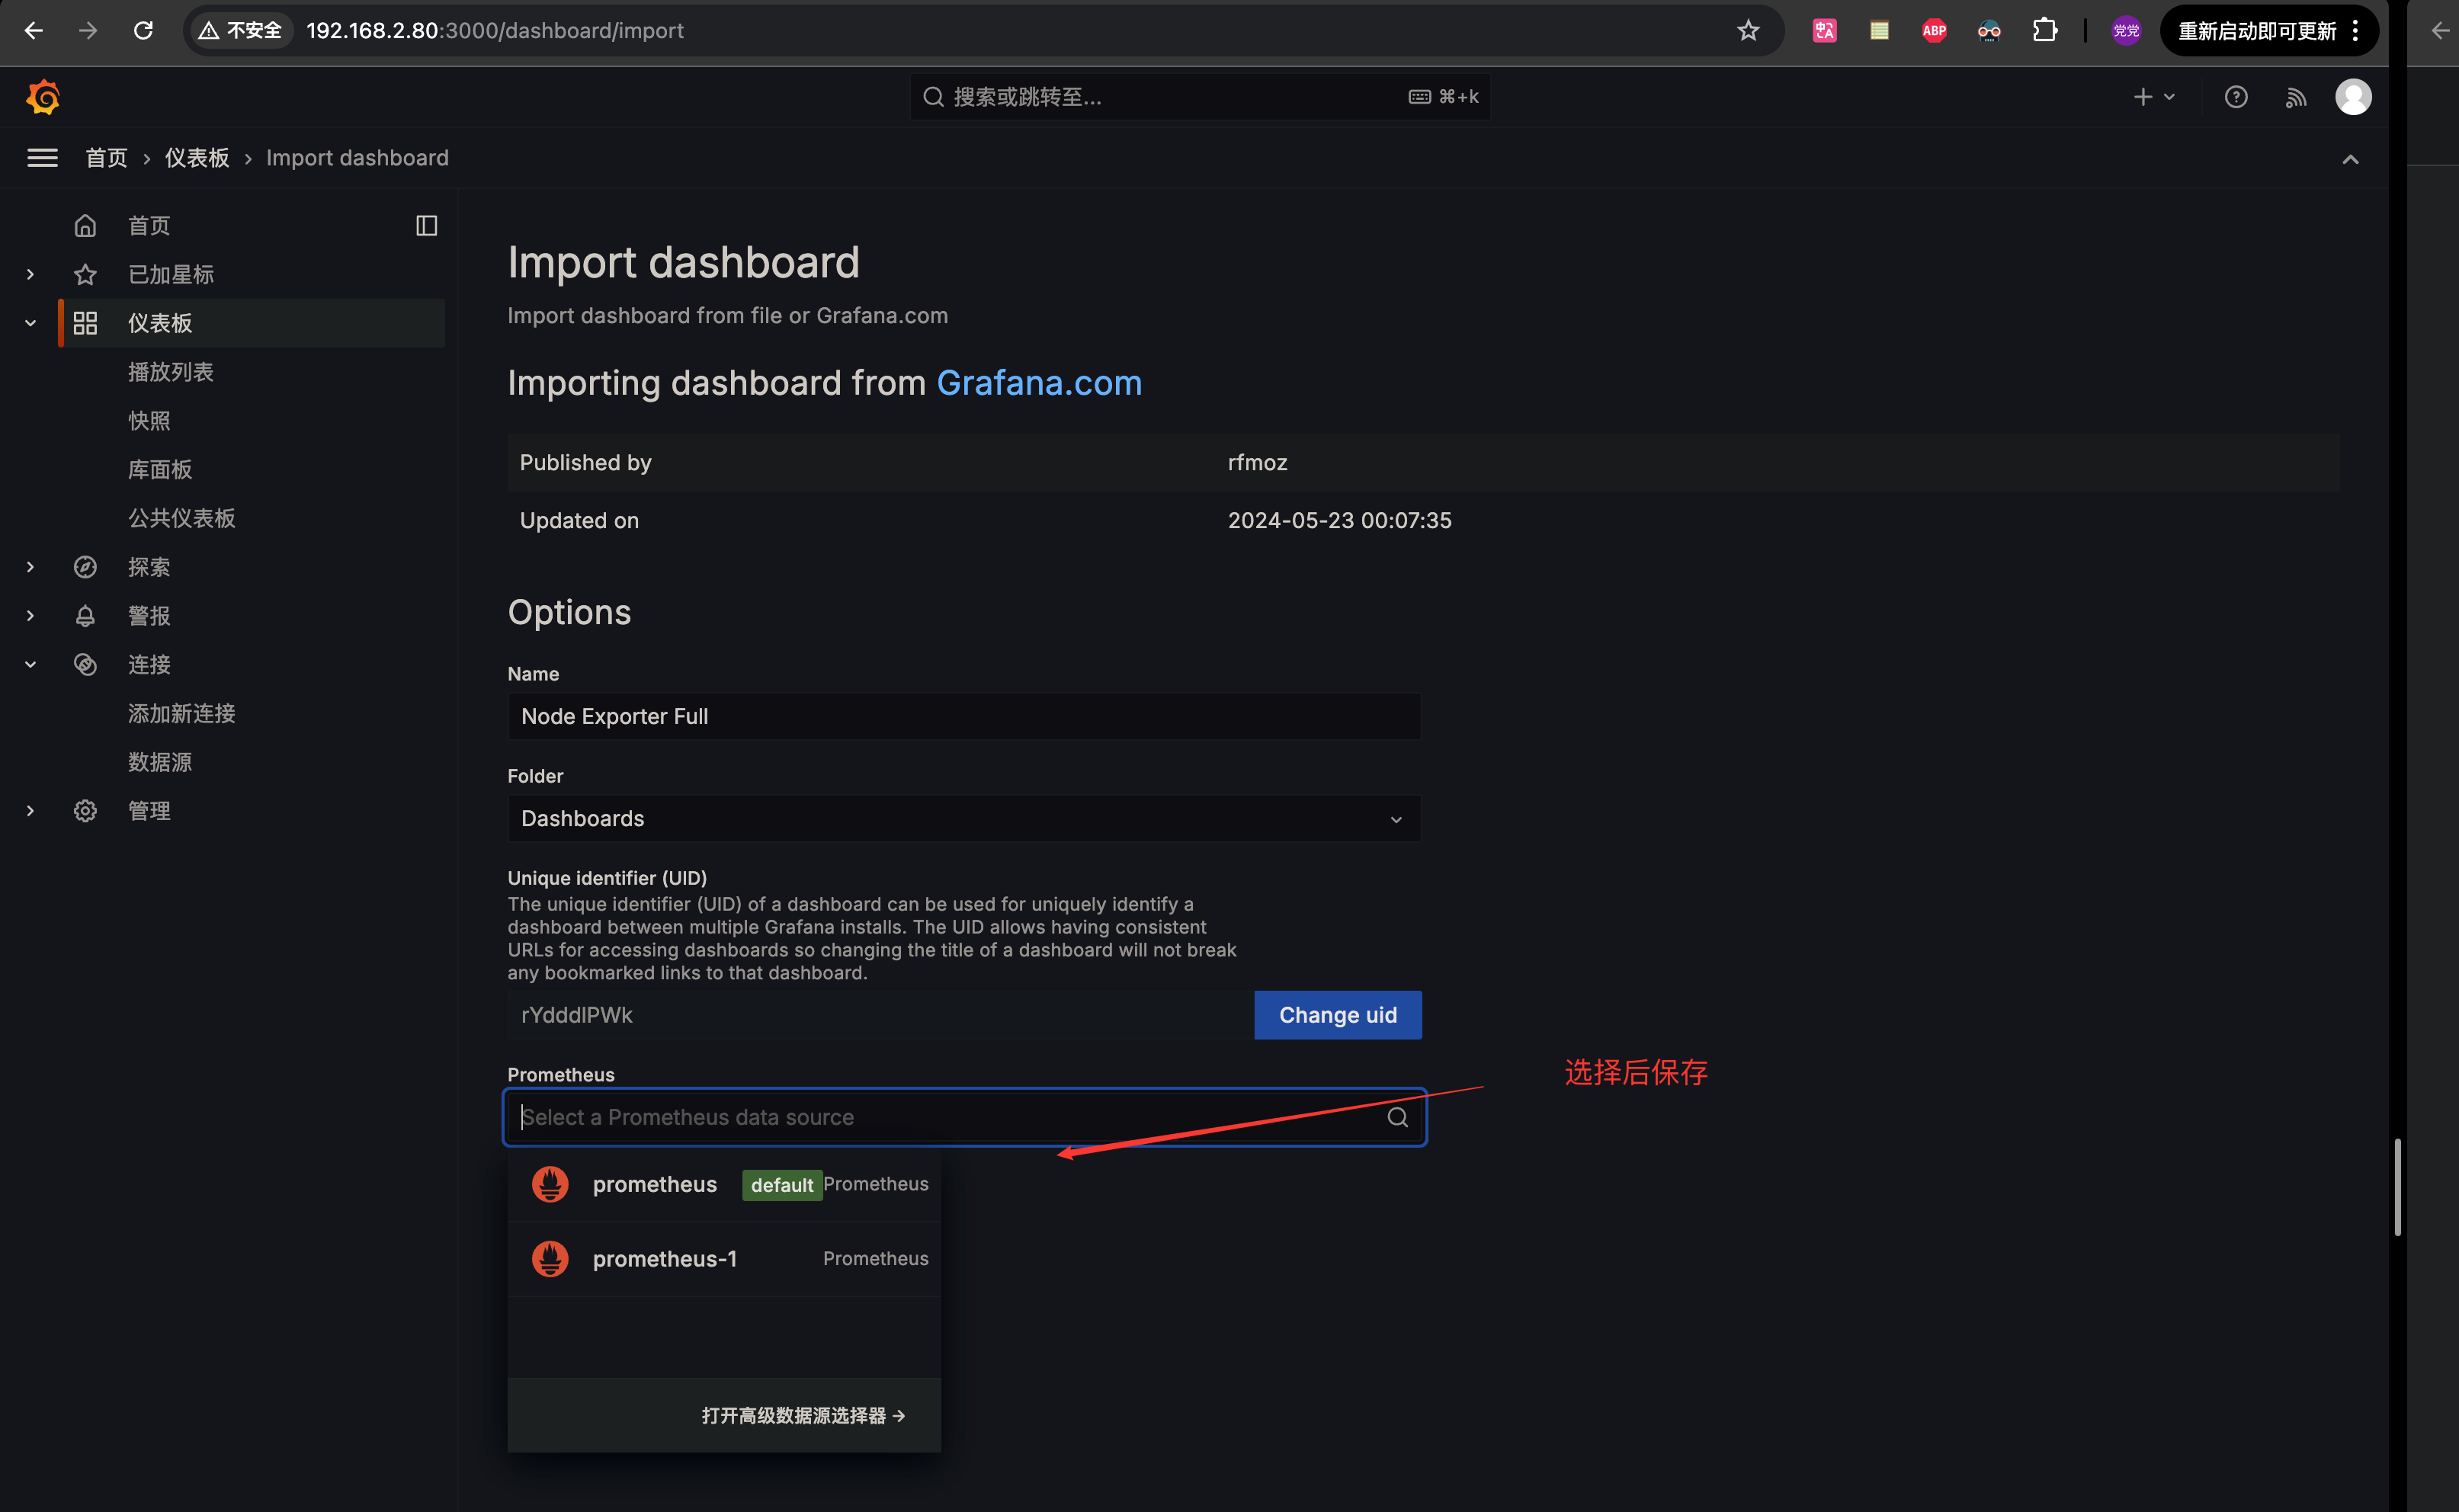
仪表板商店导出别人做好的,下面以 linux 指标监控面板为例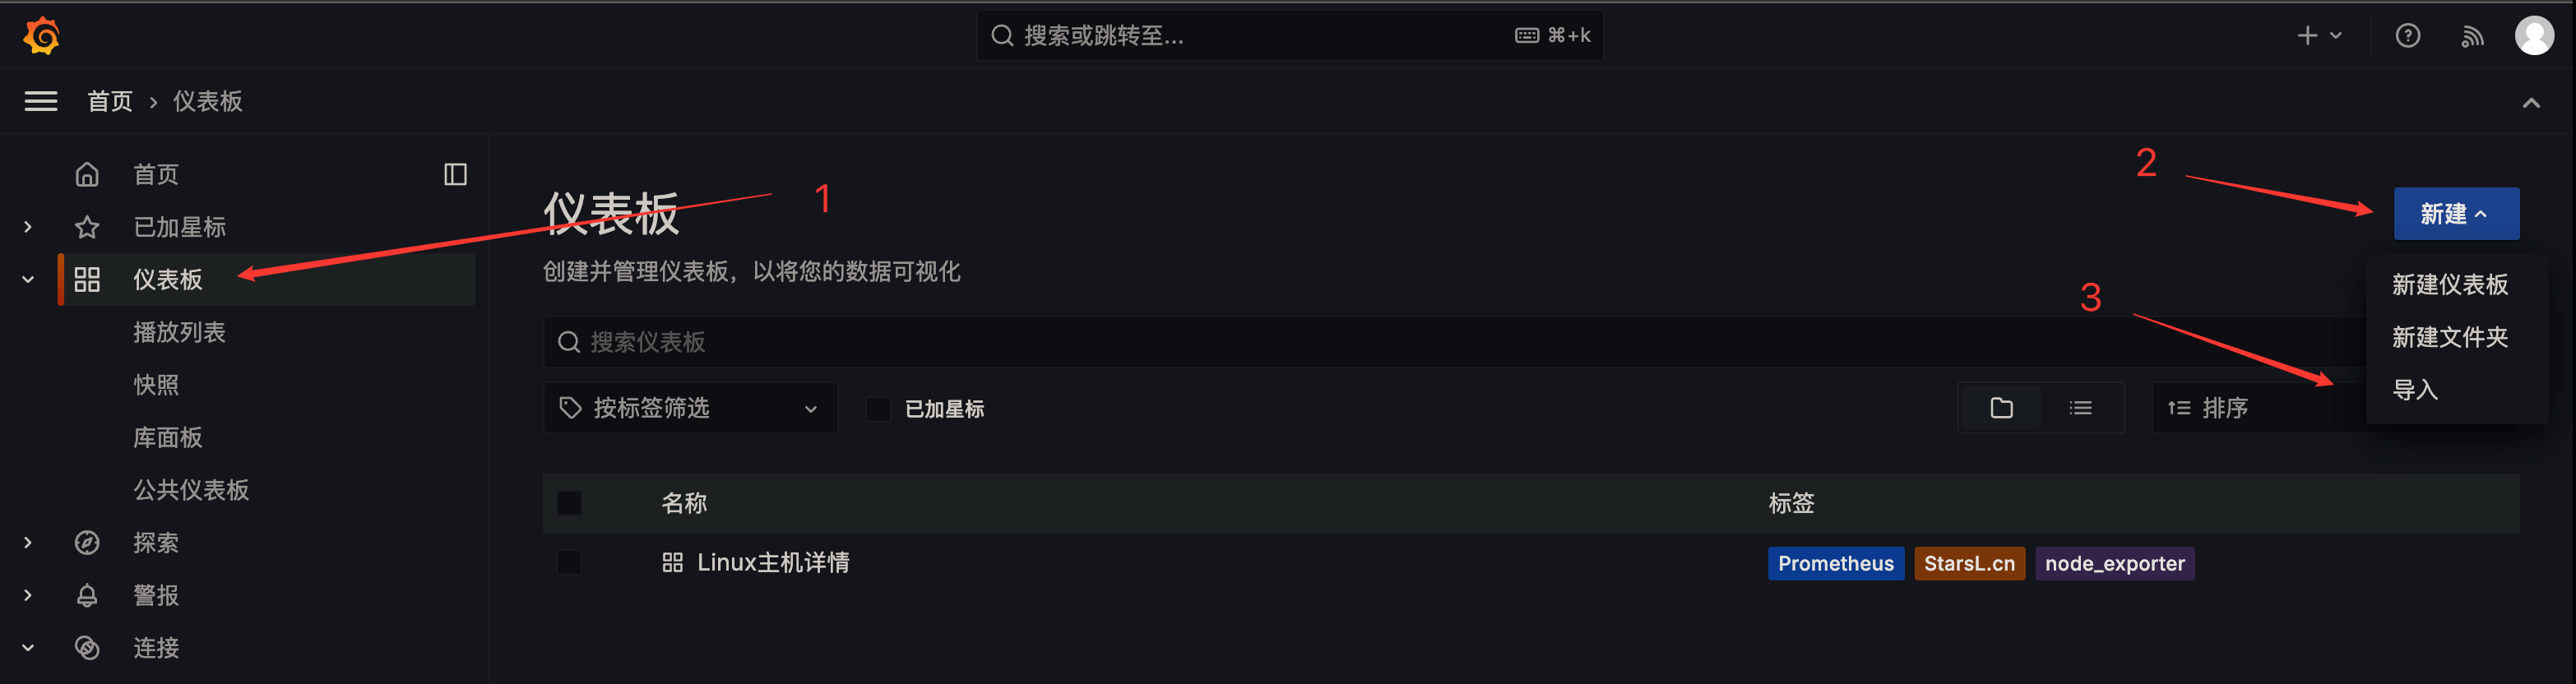
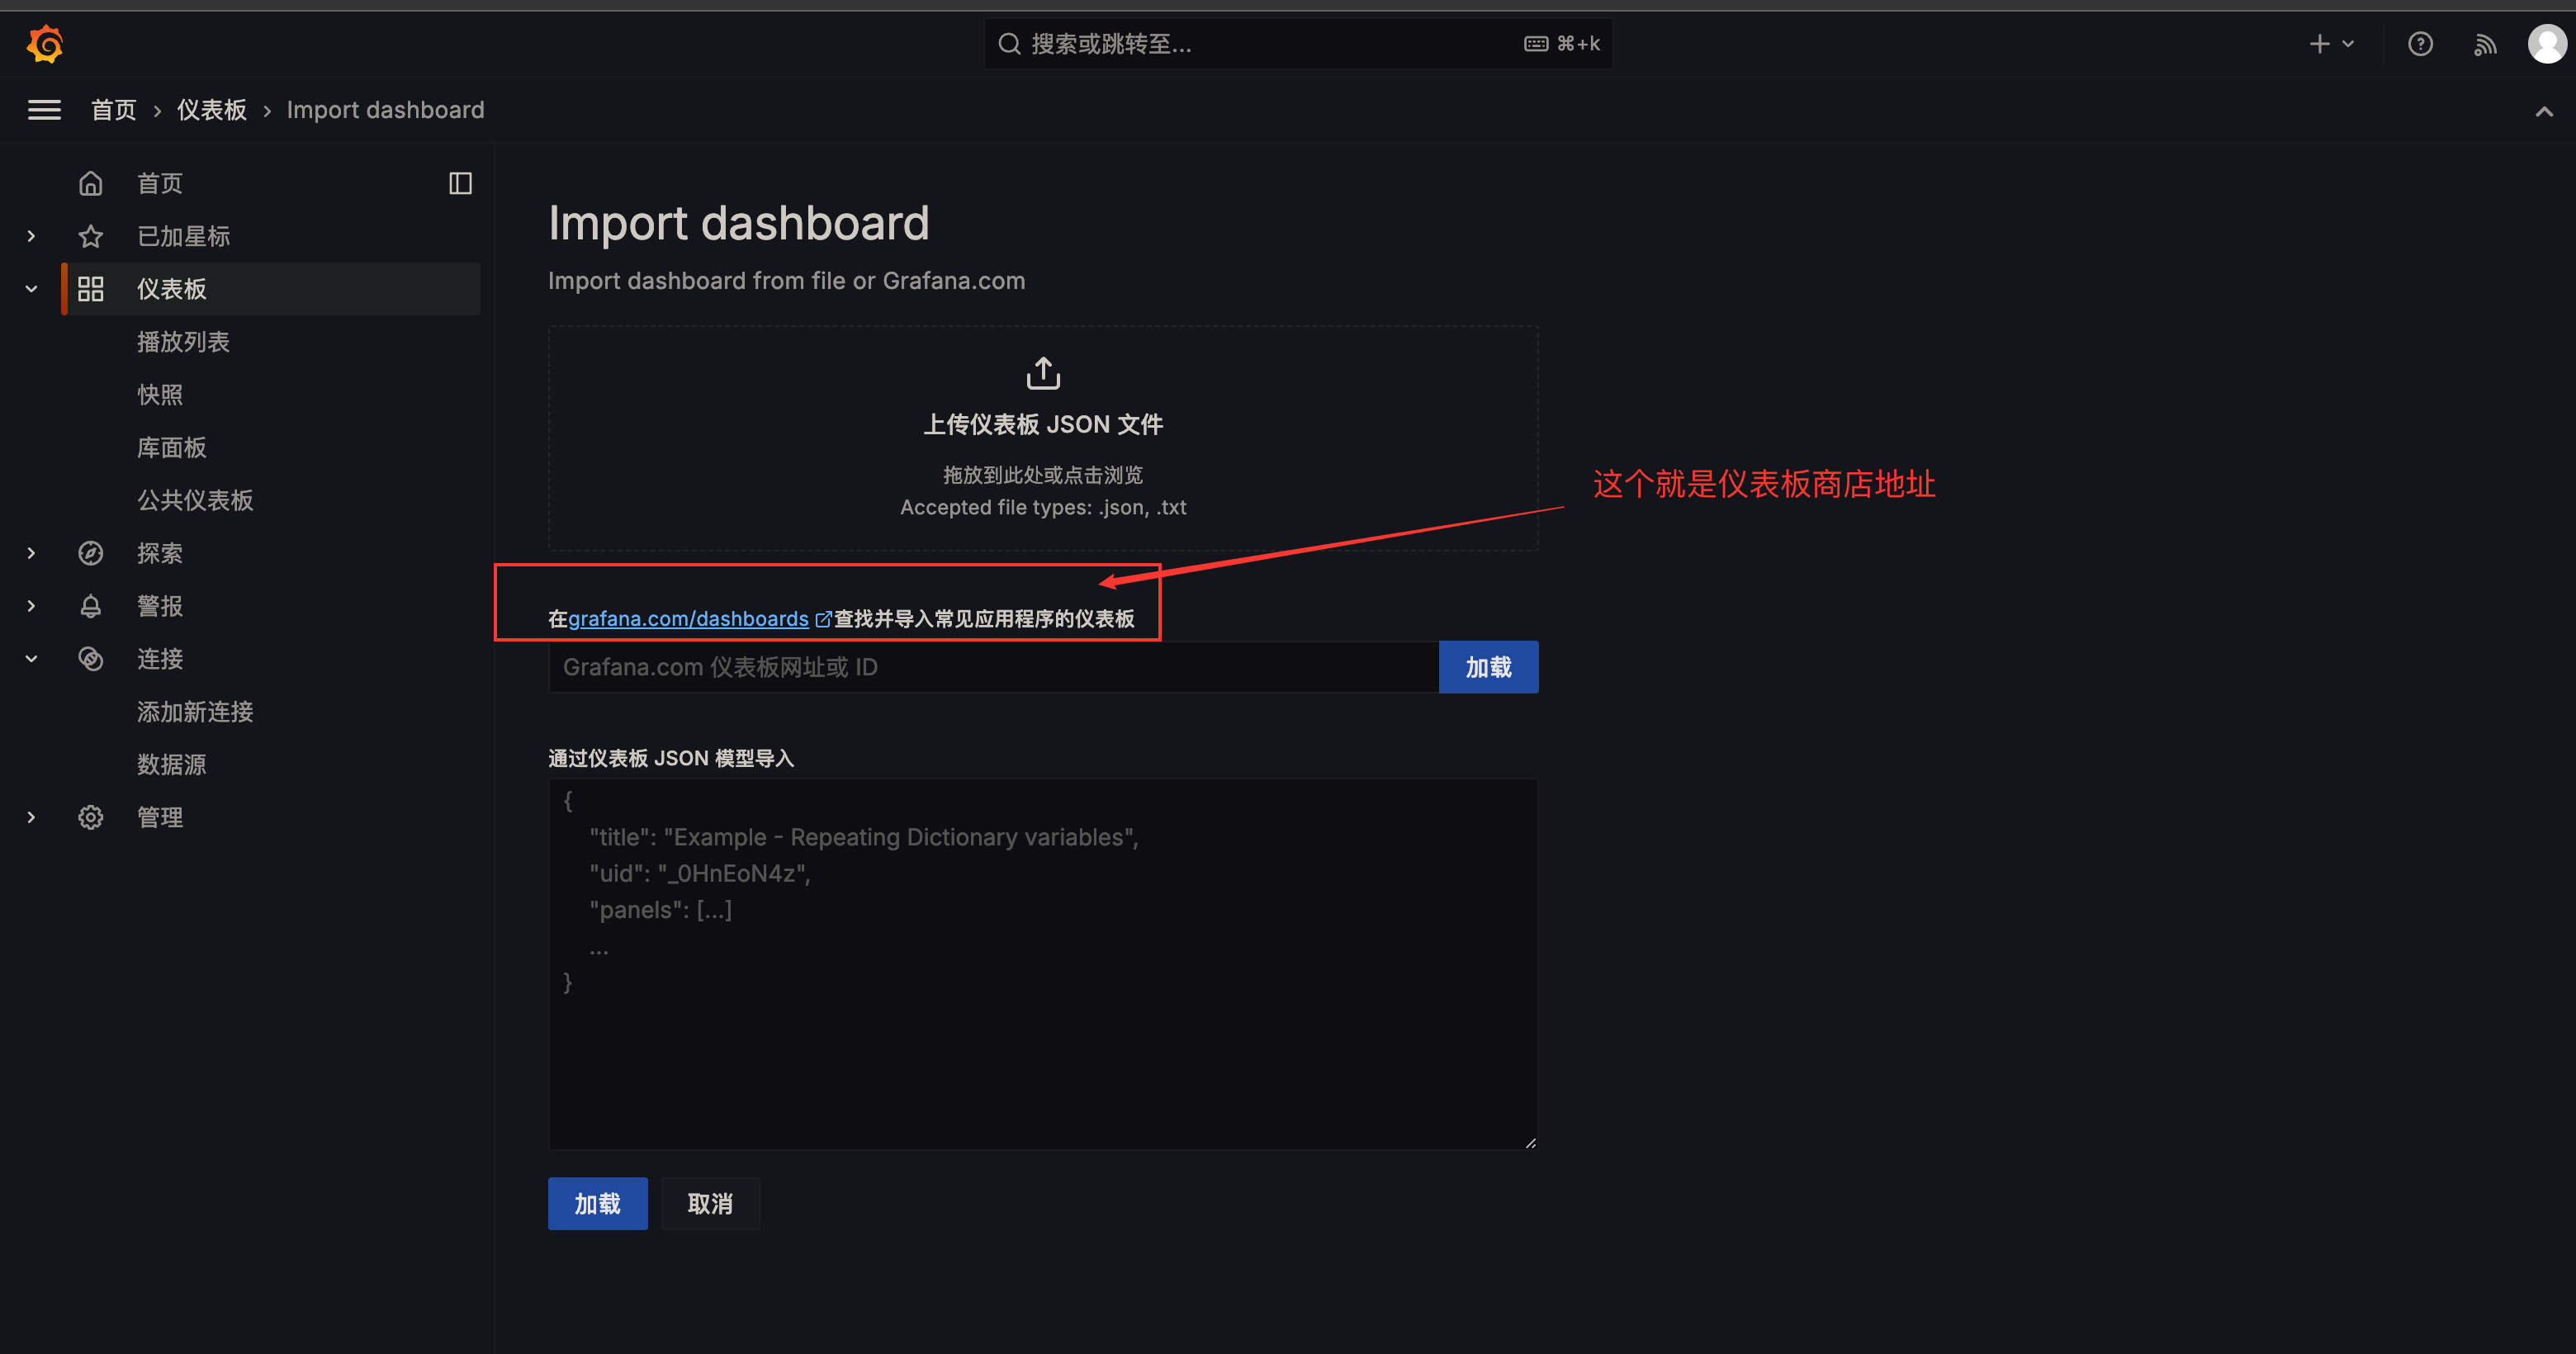
有很多自己选择
 :::
:::